Multiple Choice
The following figure shows the long-run average cost curve of a firm.
Figure 6-1
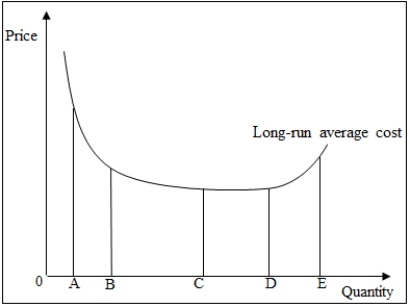
-Refer to Figure 6-1.The production function of the firm displays constant returns to scale when output is increased from _____.
A) 0A to 0E
B) 0C to 0D
C) 0D to 0E
D) 0A to 0B
E) 0B to 0D
Correct Answer:

Verified
Correct Answer:
Verified
Related Questions
Q2: A firm produces three products A, B,
Q6: If a firm were to stop production
Q16: Explain the relationship between short-run average cost
Q19: Assume that an investor invests $100,000 in
Q21: The minimum efficient scale is important in
Q22: The following figure shows the long-run average
Q26: A firm produces output at two plants
Q29: DigiWatch plans to open a new production
Q30: Firm K is a leading maker of
Q42: A profit-maximizing firm will produce at the