Multiple Choice
The following figure shows the long-run average cost curve of a firm.
Figure 6-1
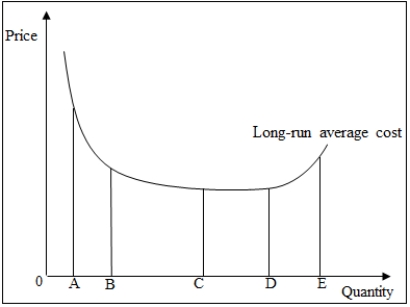
-Refer to Figure 6-1.What is the quantity that the firm will produce if it is operating at minimum efficient scale?
A) 0E
B) 0A
C) 0C
D) 0D
E) 0B
Correct Answer:

Verified
Correct Answer:
Verified
Related Questions
Q13: "All fixed costs are sunk costs and
Q17: Explain how each of the following events
Q26: A firm that produces and sells
Q39: Dana, who is a trained yoga instructor,
Q42: Amanda invests $500,000 in a new business
Q43: Which of the following is true of
Q45: The following figure shows the long-run average
Q49: A firm will continue to operate in
Q50: A lawyer is contemplating quitting her current
Q51: Which of the following is true of