Multiple Choice
Exhibit 8-3 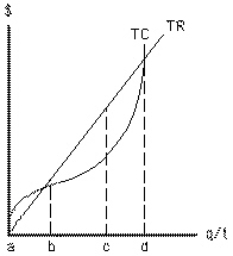 The shape of the total cost curve between outputs a and b in Exhibit 8-3 reflects
A) fixed cost
B) increasing profits
C) diminishing marginal returns
D) increasing marginal returns
E) economies of scale
Correct Answer:

Verified
Correct Answer:
Verified
Q89: Producer surplus is usually less than profit
Q90: In an increasing-cost industry, the entry of
Q91: What is always true at the quantity
Q92: Marginal revenue is<br>A)total revenue minus total cost<br>B)total
Q93: Exhibit 8-2 <img src="https://d2lvgg3v3hfg70.cloudfront.net/TB6784/.jpg" alt="Exhibit 8-2
Q95: To achieve allocative efficiency, firms<br>A)strive to minimize
Q96: A perfectly competitive firm has no control
Q97: Allocative efficiency occurs in markets when<br>A)goods are
Q98: For a perfectly competitive firm that should
Q99: The Hound Dog Bus Company contemplates expanding