Multiple Choice
Exhibit 6-29 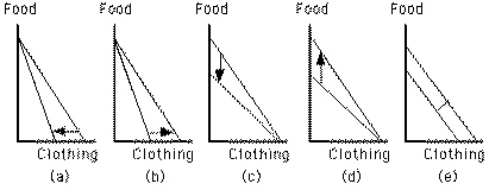 Which graph in Exhibit 6-29 shows the effect of an increase in the price of clothing, other things constant?
A) Graph a
B) Graph b
C) Graph c
D) Graph d
E) Graph e
Correct Answer:

Verified
Correct Answer:
Verified
Q96: Exhibit 6-23 <img src="https://d2lvgg3v3hfg70.cloudfront.net/TB6784/.jpg" alt="Exhibit 6-23
Q97: If the price of apples falls, the
Q98: If a good is inferior, an increase
Q99: Economists assume that, within a given budget,
Q100: A consumer allocates income between clams and
Q102: Exhibit 6-30 <img src="https://d2lvgg3v3hfg70.cloudfront.net/TB6784/.jpg" alt="Exhibit 6-30
Q103: A family on a trip budgets $200
Q104: Exhibit 6-24 <img src="https://d2lvgg3v3hfg70.cloudfront.net/TB6784/.jpg" alt="Exhibit 6-24
Q105: Exhibit 6-30 <img src="https://d2lvgg3v3hfg70.cloudfront.net/TB6784/.jpg" alt="Exhibit 6-30
Q106: All combinations of goods along a budget