Multiple Choice
Exhibit 6-29 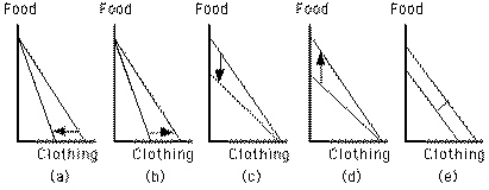 Which graph in Exhibit 6-29 shows an increase in the price of food?
A) Graph a
B) Graph b
C) Graph c
D) Graph d
E) Graph e
Correct Answer:

Verified
Correct Answer:
Verified
Q75: An increase in income is represented by
Q76: A candy bar sells for 50 cents,
Q77: Exhibit 6-24 <img src="https://d2lvgg3v3hfg70.cloudfront.net/TB6784/.jpg" alt="Exhibit 6-24
Q78: Exhibit 6-23 <img src="https://d2lvgg3v3hfg70.cloudfront.net/TB6784/.jpg" alt="Exhibit 6-23
Q79: Exhibit 6-28 <img src="https://d2lvgg3v3hfg70.cloudfront.net/TB6784/.jpg" alt="Exhibit 6-28
Q81: Which of the following would not cause
Q82: If two goods have the same price,
Q83: People change their consumption choices in response
Q84: Exhibit 6-25 <img src="https://d2lvgg3v3hfg70.cloudfront.net/TB6784/.jpg" alt="Exhibit 6-25
Q85: If a good is offered to a