Multiple Choice
Exhibit 6-29 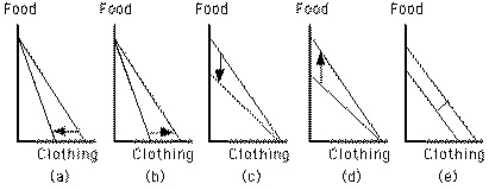 Which graph in Exhibit 6-29 shows a decrease in the price of food?
A) Graph a
B) Graph b
C) Graph c
D) Graph d
E) Graph e
Correct Answer:

Verified
Correct Answer:
Verified
Related Questions
Q38: Assume that you divide your food budget
Q39: Suppose Norm really loves coffee and Diane
Q40: For inferior goods, a rise in price
Q41: Which of the following illustrates the concept
Q42: The slope of an indifference curve is
Q44: All combinations of goods along the same
Q45: At consumer equilibrium between goods F and
Q46: A curve that shows the combination of
Q47: The slope of a budget line equals
Q48: The slope of a budget line is