Multiple Choice
Exhibit 6-29 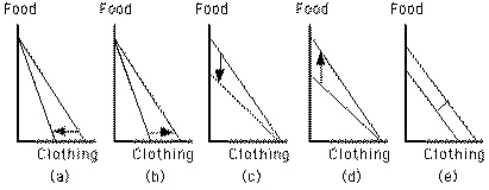 Which graph in Exhibit 6-29 shows the effect of an increase in the price of clothing and a decrease in the price of food?
A) Graph a
B) Graph b
C) Graph c
D) Graph d
E) none of these
Correct Answer:

Verified
Correct Answer:
Verified
Q3: A rotation of the budget line indicates
Q4: Exhibit 6-23 <img src="https://d2lvgg3v3hfg70.cloudfront.net/TB6784/.jpg" alt="Exhibit 6-23
Q5: Exhibit 6-25 <img src="https://d2lvgg3v3hfg70.cloudfront.net/TB6784/.jpg" alt="Exhibit 6-25
Q6: Exhibit 6-29 <img src="https://d2lvgg3v3hfg70.cloudfront.net/TB6784/.jpg" alt="Exhibit 6-29
Q7: A consumer maximizes utility where the<br>A)budget line
Q9: If a consumer purchases only one good,
Q10: Which of the following is not a
Q11: Exhibit 6-27 <img src="https://d2lvgg3v3hfg70.cloudfront.net/TB6784/.jpg" alt="Exhibit 6-27
Q12: Exhibit 6-25 <img src="https://d2lvgg3v3hfg70.cloudfront.net/TB6784/.jpg" alt="Exhibit 6-25
Q13: What would happen to the budget line