Multiple Choice
Exhibit 1-1 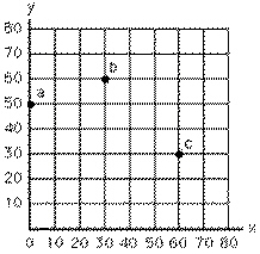 Point b in Exhibit 1-1 represents
A) x = 30, y = 60
B) x = 60, y = 30
C) x + y = 60
D) x + y = 30
E) b = 90
Correct Answer:

Verified
Correct Answer:
Verified
Related Questions
Q58: On a graph, the origin represents<br>A)the dependent
Q59: The slope of a horizontal straight line
Q60: If slope = -2 for a line
Q61: If slope = 2 for a line
Q62: Exhibit 1-9 <img src="https://d2lvgg3v3hfg70.cloudfront.net/TB6784/.jpg" alt="Exhibit 1-9
Q64: Suppose y is measured on the vertical
Q65: Most economics graphs reflect the relationship between
Q66: Moderate exercise is better than none, but
Q67: The numerical value of the slope of
Q68: A downward-sloping straight line has a decreasing