Multiple Choice
Use the following to answer question: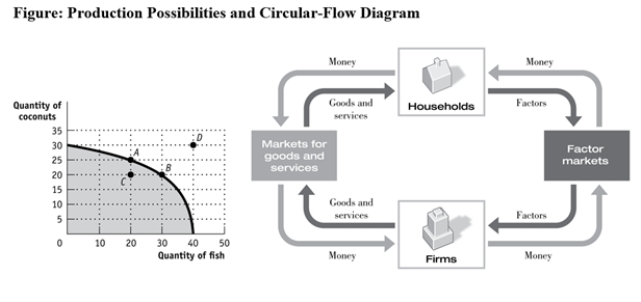
-(Figure: Production Possibilities and Circular-Flow Diagram) Use Figure: Production Possibilities and Circular-Flow Diagram.Assume the two figures represent the same economy.Suppose that in the circular-flow diagram capital that used to flow to firms producing coconuts now flows to firms producing fish.This adjustment in the economy would be BEST represented in the production possibilities figure by a move from point A toward:
A) point A (no movement) .
B) point B (a decrease in coconut production and an increase in fish production) .
C) point C (a decrease in coconut production) .
D) point D (an outward shift of the entire curve) .
Correct Answer:

Verified
Correct Answer:
Verified
Q251: Which statement is positive?<br>A)The rate of unemployment
Q252: All points inside the production possibility frontier
Q253: If the opportunity cost of manufacturing machinery
Q254: Use the following to answer question:<br><img src="https://d2lvgg3v3hfg70.cloudfront.net/TB6643/.jpg"
Q255: Consider a production possibility frontier for Italy.If
Q257: The financial meltdown in 2008-2009 was partially
Q258: Nations can gain from trade with other
Q259: Use the following to answer question: <img
Q260: The economy with the LOWEST opportunity cost
Q261: Use the following to answer question:<br><img src="https://d2lvgg3v3hfg70.cloudfront.net/TB6643/.jpg"