Multiple Choice
Use the following to answer question: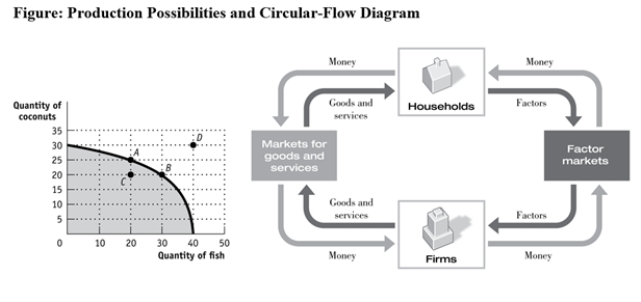
-(Figure: Production Possibilities and Circular-Flow Diagram) Use Figure: Production Possibilities and Circular-Flow Diagram.Assume the two figures represent the same economy.Suppose that in the circular-flow diagram there is a significant increase in the amount of human capital flowing to both coconut producers and fish producers.If all other variables remain unchanged,then the adjustment in this economy would be BEST represented in the production possibilities figure by a movement from point A toward:
A) point A (no movement) .
B) point B (a decrease in coconut production and an increase in fish production) .
C) point C (a decrease in coconut production) .
D) point D (an outward shift of the entire curve) .
Correct Answer:

Verified
Correct Answer:
Verified
Q141: Use the following to answer question: <img
Q142: Economic models that make unrealistic assumptions may
Q143: In the circular-flow diagram,the flow of money
Q144: Before 2000,the mortgage-backed securities market was relatively
Q145: Which statement is positive? Which statement is
Q147: Use the following to answer question: <img
Q148: Mary spends $5 on food for her
Q149: In the product market,households buy goods and
Q150: The production possibility frontier will NOT shift
Q151: The basis of the circular-flow diagram is