Multiple Choice
Use the following to answer question: 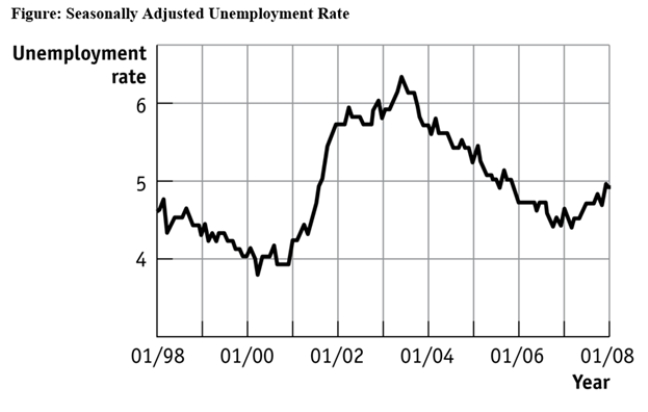
-(Figure: Seasonally Adjusted Unemployment Rate) Use Figure: Seasonally Adjusted Unemployment Rate.The distance between each labeled point on the horizontal axis is one year,and the distance between each labeled point on the vertical axis is one percentage point of unemployment.What is the approximate slope of the graph between 1/2001 and 1/2003 (using percentage point and years as the units on the vertical and horizontal axes,respectively) ?
A) 2
B) 1
C) -1
D) -2
Correct Answer:

Verified
Correct Answer:
Verified
Q42: Use the following to answer question: <img
Q43: Use the following to answer question: <img
Q44: A positive relationship between swimsuits purchased and
Q45: Use the following to answer question: <img
Q46: If two variables are negatively related:<br>A)as one
Q48: A bar graph:<br>A)is useful when showing what
Q49: Use the following to answer question: <img
Q50: A scatter diagram shows:<br>A)how far apart dependent
Q51: If two variables are positively related:<br>A)as one
Q52: Use the following to answer question: <img