Multiple Choice
Use the following to answer question: 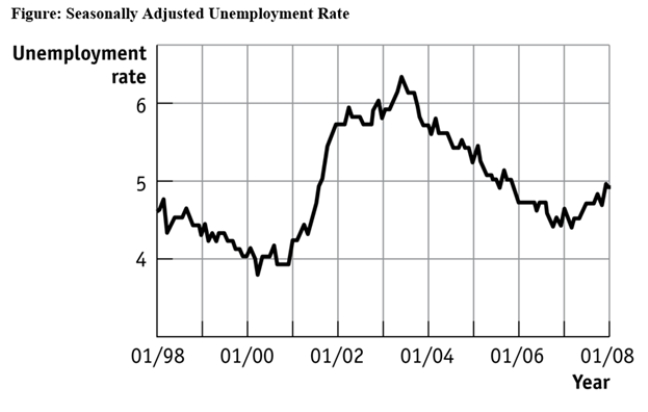
-(Figure: Seasonally Adjusted Unemployment Rate) Use Figure: Seasonally Adjusted Unemployment Rate.The distance between each labeled point on the horizontal axis is one year,and the distance between each labeled point on the vertical axis is one percentage point of unemployment.Unemployment was _____ between 1/2001 and 1/2002 and _____ between 1/1999 and 1/2000.
A) increasing;decreasing
B) increasing;increasing
C) decreasing;increasing
D) decreasing;decreasing
Correct Answer:

Verified
Correct Answer:
Verified
Q21: The fact that two variables always move
Q22: The relation between two variables that move
Q23: Use the following to answer question: <img
Q24: A _ graph shows how the value
Q25: The owner of the Dismal Philosopher,one of
Q27: Use the following to answer question: <img
Q28: Use the following to answer question: <img
Q29: The ratio of the change in the
Q30: Use the following to answer question: <img
Q31: Use the following to answer question: <img