Multiple Choice
Use the following to answer question: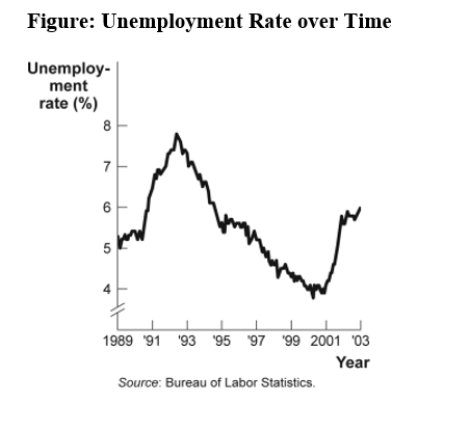
-(Figure: Unemployment Rate over Time) Look at the figure Unemployment Rate over Time.In the time-series graph,as we move from the beginning of 2001 to the beginning of 2003,we see that the unemployment rate has _____ from approximately _____ to approximately _____.
A) decreased;5%;4%
B) increased;5.3%;7.3%
C) decreased;7.7%;5.5%
D) increased;4%;6%
Correct Answer:

Verified
Correct Answer:
Verified
Q30: Use the following to answer question: <img
Q31: Use the following to answer question: <img
Q32: Use the following to answer question: <img
Q33: Use the following to answer question: <img
Q34: Use the following to answer question: <img
Q36: Use the following to answer question: <img
Q37: The scaling of the axes of a
Q38: Use the following to answer question:<br><img src="https://d2lvgg3v3hfg70.cloudfront.net/TB6643/.jpg"
Q39: A linear curve has the same slope
Q40: Use the following to answer question: <img