Multiple Choice
(Figure: The Optimal Quantity of Pollution) Use Figure: The Optimal Quantity of Pollution.The figure shows the marginal social cost (MSC) and marginal social benefit (MSB) for firms that pollute the air with sulfur dioxide.Using the figure,the optimal Pigouvian tax per unit of pollution is: Figure: The Optimal Quantity of Pollution 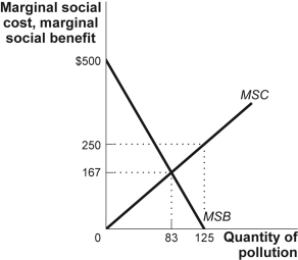
A) $500.
B) $250.
C) $167.
D) $83.
Correct Answer:

Verified
Correct Answer:
Verified
Q65: Use the following to answer question: <img
Q66: The most economically efficient way to reduce
Q67: Laws that require vehicles to have catalytic
Q68: Use the following to answer question:<br>Figure: Pollution
Q69: Use the following to answer question:<br>Figure: City
Q71: Assume that the federal government determines the
Q72: Which statement describes a positive externality?<br>A)Sam dug
Q73: Use the following to answer question:<br>Figure: Pollution
Q74: The marginal social cost of pollution emissions
Q75: Use the following to answer question: <img