Multiple Choice
Use the following to answer question:
Figure: The Socially Optimal Quantity of Pollution 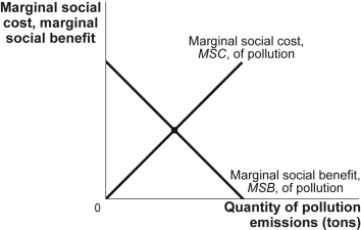
-(Figure: The Socially Optimal Quantity of Pollution) Use Figure: The Socially Optimal Quantity of Pollution.In the figure,firms are the only beneficiaries of pollution,and costs are borne solely by others in the society.The optimal level of pollution is:
A) zero since no pollution is best for society.
B) where the marginal social benefit curve intersects the quantity axis.
C) where the marginal social cost curve intersects the quantity axis.
D) where the marginal social benefit curve intersects the marginal social cost curve.
Correct Answer:

Verified
Correct Answer:
Verified
Q42: An emissions tax will:<br>A)ensure that the marginal
Q43: A plastics manufacturing plant dumps pollution into
Q44: Use the following to answer question:<br>Figure: Efficiency
Q45: A principal cause of market failure is
Q46: There are benefits resulting indirectly from pollution
Q48: Use the following to answer question:<br>Figure: City
Q49: If a good that involves external costs
Q50: Whenever human activity generates a concentration of
Q51: If the marginal social benefit received from
Q52: Suppose the federal government determines the total