Multiple Choice
Use the figure below to answer the following questions. 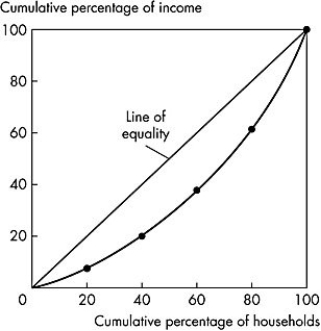 Figure 18.1.1
-Refer to Figure 18.1.1.The poorest 20 percent of households receive what share of total income?
A) 40 percent
B) 60 percent
C) 20 percent
D) 5 percent
E) 10 percent
Correct Answer:

Verified
Correct Answer:
Verified
Q96: In 2015,the median household income in Canada
Q97: The six household characteristics that stand out
Q98: In 2015,what percentage of households received the
Q99: If each household made the same amount
Q100: In 2015,the 20 percent of Canadian households
Q102: The income distribution in Canada is<br>A)bell-shaped.<br>B)positively skewed.<br>C)negatively
Q103: Use the table below to answer the
Q104: The Gini ratio for a perfectly equal
Q105: The distribution of annual income<br>A)understates the degree
Q106: In Canada,the highest income tax rates are