Multiple Choice
Use the figure below to answer the following questions. 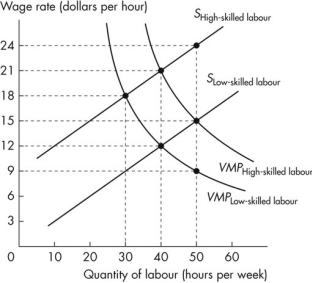 Figure 18.3.5
-Refer to Figure 18.3.5.This figure shows the labour supply curves and the value of marginal product curves for high-skilled and low-skilled workers.The equilibrium wage rate for low-skilled workers is
A) $9 an hour.
B) $21 an hour.
C) $18 an hour.
D) $15 an hour.
E) $12 an hour.
Correct Answer:

Verified
Correct Answer:
Verified
Q105: The distribution of annual income<br>A)understates the degree
Q106: In Canada,the highest income tax rates are
Q107: The three main avenues through which the
Q108: Use the figure below to answer the
Q109: Between 1976 and 2015,the Canadian Gini ratio
Q110: Incomes in China and India are a
Q112: Poverty is<br>A)an income below the national average
Q113: Use the table below to answer the
Q114: The demand for low-skilled labour is derived
Q115: One criticism of social security programs such