Multiple Choice
Use the figure below to answer the following questions. 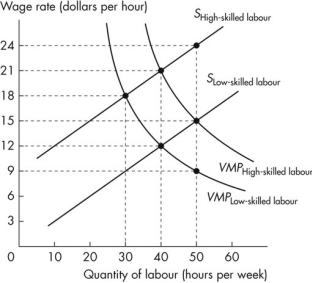 Figure 18.3.5
-Refer to Figure 18.3.5.This figure shows the labour supply curves and the value of marginal product curves for high-skilled and low-skilled workers.The equilibrium wage rate for high-skilled workers is
A) $15 an hour.
B) $12 an hour.
C) $18 an hour.
D) $24 an hour.
E) $21 an hour.
Correct Answer:

Verified
Correct Answer:
Verified
Q64: Use the figure below to answer the
Q65: Use the figure below to answer the
Q66: In 2015,the mean household income in Canada
Q67: Use the figure below to answer the
Q68: In the absence of government policies to
Q70: The low-income cutoff level is<br>A)a level of
Q71: Economists who have compared the incomes of
Q72: The income Lorenz curve illustrates the distribution
Q73: The distribution of world income is _
Q74: Among Canada,Finland,and South Africa,income is distributed most