Multiple Choice
Use the figure below to answer the following questions. 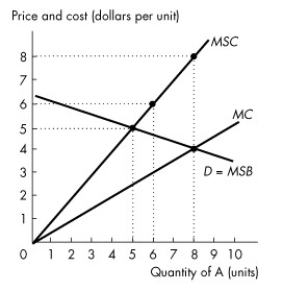 Figure 15.2.2
-Refer to Figure 15.2.2.This figure shows the demand curve,the marginal private cost curve and the marginal social cost curve of good A.How many units of good A are produced in an unregulated market?
A) 0 units
B) 5 units
C) 6 units
D) 8 units
E) 9 units
Correct Answer:

Verified
Correct Answer:
Verified
Related Questions
Q78: Which of the following is least likely
Q79: Use the table below to answer the
Q80: Use the table below to answer the
Q81: A well-maintained waterfront property that is enjoyed
Q82: Use the figure below to answer the
Q84: The economic benefit of a patent or
Q85: Which one of the following is a
Q86: Use the table below to answer the
Q87: Use the table below to answer the
Q88: Use the table below to answer the