Multiple Choice
Use the figure below to answer the following questions. 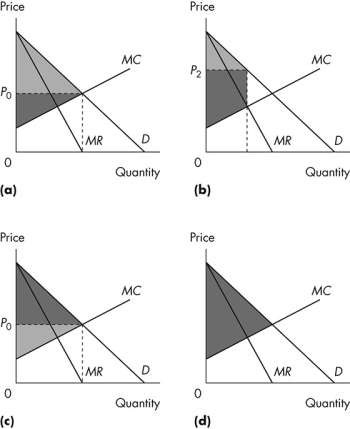 Figure 12.3.2
-Consider Figure 12.3.2.The light grey area shows consumer surplus,and the dark grey area shows producer surplus.Which graph illustrates a perfectly competitive market?
A) (a)
B) (b)
C) (c)
D) (d)
E) (b) and (d)
Correct Answer:

Verified
Correct Answer:
Verified
Related Questions
Q68: Use the figure below to answer the
Q69: Which of the following markets will have
Q70: Use the figure below to answer the
Q71: Use the figure below to answer the
Q72: Use the table below to answer the
Q74: Use the information below to answer the
Q75: Use the figure below to answer the
Q76: Use the table below to answer the
Q77: Use the figure below to answer the
Q78: Social interest theory predicts that the political