Multiple Choice
Use the figure below to answer the following questions. 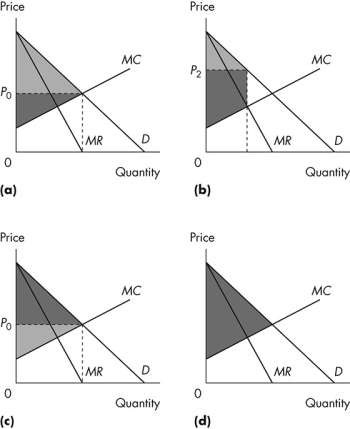 Figure 12.3.2
-Consider Figure 12.3.2.The light grey area shows consumer surplus,and the dark grey area shows producer surplus.Which graph illustrates a single-price monopoly?
A) (a)
B) (b)
C) (c)
D) (d)
E) (b) and (c)
Correct Answer:

Verified
Correct Answer:
Verified
Q6: An efficient use of resources occurs when<br>A)a
Q7: The pursuit of wealth by capturing economic
Q8: Use the figure below to answer the
Q9: Consider the single-price monopoly illustrated in Figure
Q10: Use the figure below to answer the
Q12: Suppose in an industry a firm realizes
Q13: The output of a (not perfect)price-discriminating monopoly
Q14: A monopoly _ make positive economic profit
Q15: For a regulated natural monopoly,an average cost
Q16: Use the figure below to answer the