Multiple Choice
Use the figure below to answer the following question. 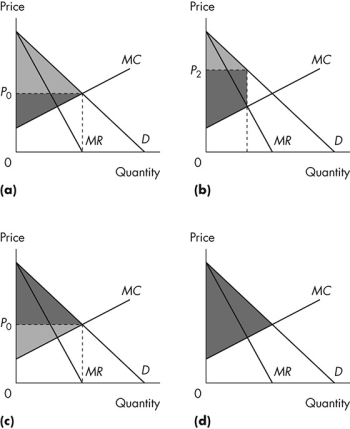 Figure 12.4.4
-Refer to Figure 12.4.4.The light grey area shows consumer surplus and the dark grey area shows producer surplus.Which graph illustrates a perfect price-discriminating monopoly?
A) (a)
B) (b)
C) (c)
D) (d)
E) (a) and (c)
Correct Answer:

Verified
Correct Answer:
Verified
Q49: A perfect price-discriminating monopoly<br>A)has a demand curve
Q50: Use the figure below to answer the
Q51: Use the figure below to answer the
Q52: A perfect price-discriminating monopoly is<br>A)less efficient than
Q53: Capture theory states that<br>A)public officials favour consumers
Q55: Which of the following is a characteristic
Q56: Use the figure below to answer the
Q57: Regulation of a natural monopoly will maximize
Q58: Rate of return regulation can end up
Q59: The more perfectly a monopoly can price