Multiple Choice
Use the figure below to answer the following questions. 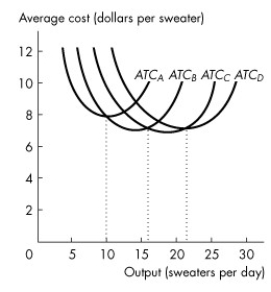 Figure 10.4.2
-Refer to Figure 10.4.2,which illustrates the short-run average total cost curves for four different plant sizes.Which plant has the lowest average total cost for an output rate of 5 sweaters a day?
A) Plant A
B) Plant B
C) Plant C
D) Plant D
E) The plant with the fewest workers
Correct Answer:

Verified
Correct Answer:
Verified
Q34: Use the figure below to answer the
Q35: Choose the correct statement.<br>A)The long run is
Q36: An increase in the cost of labour
Q37: If the ATC curve is falling then
Q38: Marginal cost<br>A)is constantly increasing,but as output increases
Q40: Use the table below to answer the
Q41: The minimum efficient scale is the smallest
Q42: In general, (1)opportunity cost is greater than
Q43: Diseconomies of scale refer to the range
Q44: When the 7th worker is hired,output increases