Multiple Choice
Use the figure below to answer the following question. 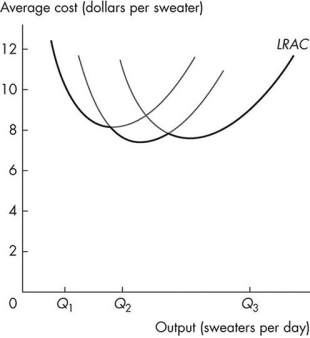 Figure 10.4.3
-Refer to Figure 10.4.3 which shows a firm's long-run average total cost curve.When production increases from Q1 to Q2 sweaters per day,the firm experiences
A) a decrease in fixed costs.
B) economies of scale.
C) diseconomies of scale.
D) constant total costs.
E) constant returns to scale.
Correct Answer:

Verified
Correct Answer:
Verified
Q47: A firm experiences _ when its _
Q48: Which of the following statements by a
Q49: The ATC curve shifts upward if<br>A)factor prices
Q50: The MC curve shifts upward if<br>A)factor prices
Q51: Ernie's Earmuffs produces 200 earmuffs per year
Q53: When the marginal product of labour is
Q54: When the demand for electricity peaks during
Q55: The long run refers to a time
Q56: Economic profit equals total revenue minus<br>A)the cost
Q57: Use the table below to answer the