Multiple Choice
Use the figure below to answer the following questions. 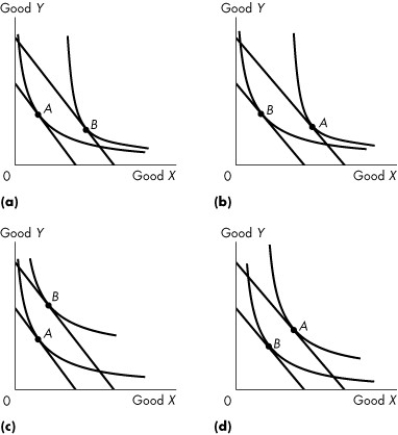 Figure 9.3.4
Original equilibrium at A,new equilibrium at B
-Refer to Figure 9.3.4.Which graphs show the case where good Y is an inferior good?
A) (a) and (b)
B) (c) and (d)
C) (a) and (c)
D) (b) and (d)
E) none of the graphs
Correct Answer:

Verified
Correct Answer:
Verified
Q109: A rise in the price of gasoline,everything
Q110: A preference map is<br>A)a series of points
Q111: Which one of the following statements is
Q112: If the price of a normal good
Q113: A change in the price of the
Q115: Martha consumes cake and muffins.Suppose Martha's income
Q116: The substitution effect is the effect of<br>A)a
Q117: A consumer's best affordable point occurs<br>A)inside the
Q118: Guy has an income (Y)of $50 with
Q119: Leah consumes at a point on her