Multiple Choice
Refer to the figure below to answer the following questions. 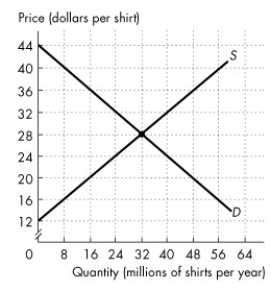 Figure 7.1.1
The figure shows the market for shirts in Canada,where D is the domestic demand curve and S is the domestic supply curve.The world price is $20 per shirt.
-In Figure 7.1.1,with international trade,________ million shirts per year are produced in Canada.
A) 48
B) 32
C) 20
D) 56
E) 16
Correct Answer:

Verified
Correct Answer:
Verified
Q52: Which of the following are reasons economists
Q53: A country moves from a situation of
Q54: A country<br>A)imports those goods in which it
Q55: Canada has a comparative advantage in producing
Q56: When a Canadian firm implements offshore outsourcing,consumers
Q58: The infant industry argument is based on
Q59: An import quota is<br>A)a tariff that is
Q60: The goods and services we sell to
Q61: Refer to the figure below to answer
Q62: The effects of offshore outsourcing from opening