Multiple Choice
Refer to the figure below to answer the following question. 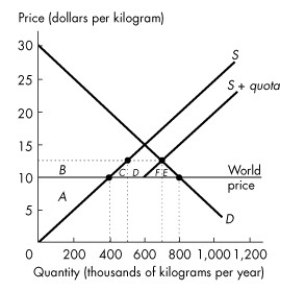 Figure 7.3.2
-Refer to Figure 7.3.2.The supply of peanuts in Canada is made up of Canadian grown peanuts and imported peanuts.Initially,Canada engages in free trade in the peanut market.Then Canada puts a quota on peanut imports.The graph shows the Canadian market for peanuts when the Canadian government puts a quota on peanut imports.The Canadian consumer surplus that is redistributed to Canadian producers is ________ and the quota creates a deadweight loss equal to ________.
A) area B + C + D + E;zero
B) area B + C + F;area D
C) area B;area D + E
D) area B;area C + E
E) area B + C + D;area E + F
Correct Answer:

Verified
Correct Answer:
Verified
Q14: Compared to the situation before international trade,after
Q15: Import quotas _ the price of imported
Q16: Refer to the figure below to answer
Q17: Of the groups listed below,which is most
Q18: An import quota is a<br>A)tariff imposed on
Q20: If Canada imposes a tariff on imported
Q21: A Canadian tariff imposed on items that
Q22: A country moves from a situation of
Q23: The gains from free trade are enjoyed
Q24: When Canada exports a good,Canada's consumer surplus