Multiple Choice
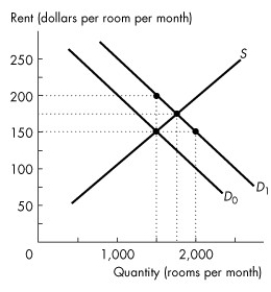
Use the figure below to answer the following questions.  Figure 6.1.1
-Refer to Figure 6.1.1.Suppose the demand for rental housing is shown by demand curve D1,and there is a rent ceiling of $150 per room.What is the potential loss from housing search?
A) $300,000
B) $225,000
C) $50
D) $75,000
E) $0
Correct Answer:

Verified
Correct Answer:
Verified
Related Questions
Q68: Use the figure below to answer the
Q69: Consider a market for an illegal good.If
Q70: The burden of the tax on buyers
Q71: Use the table below to answer the
Q72: Use the figure below to answer the
Q74: The demand for a good and the
Q75: An effective rent ceiling<br>A)increases producer surplus.<br>B)results in
Q76: Use the figure below to answer the
Q77: Use the figure below to answer the
Q78: When a sales tax is imposed on