Multiple Choice
Use the figure below to answer the following questions. 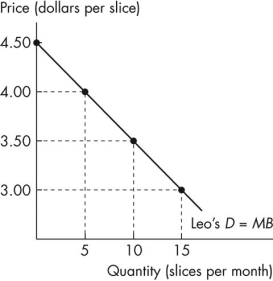
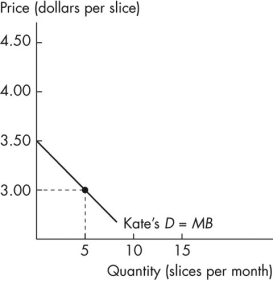 Figure 5.2.4a Figure 5.2.4b
-Figure 5.2.4 shows Leo's demand curve for pizza in the left graph and Kate's demand curve for pizza in the right graph.Leo and Kate are the only two consumers in the market.If the market price is $3 a slice,what is the quantity demanded in the market?
A) 15 slices
B) 5 slices
C) 20 slices
D) 10 slices
E) 25 slices
Correct Answer:

Verified
Correct Answer:
Verified
Q89: Choose the statement or statements that are
Q90: Use the figure below to answer the
Q91: Use the figure below to answer the
Q92: It is efficient to produce an additional
Q93: A market supply curve is<br>A)the horizontal sum
Q95: Use the information below to answer the
Q96: When 2,000 hamburgers a day are produced,the
Q97: Producer surplus is<br>A)the difference between the maximum
Q98: In a command system,resources are allocated by<br>A)force.<br>B)people
Q99: If you increase your consumption of pop