Multiple Choice
Use the figure below to answer the following question. 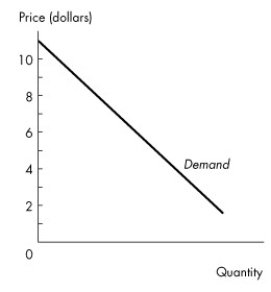 Figure 4.1.1
-Figure 4.1.1 illustrates a linear demand curve.Comparing the price elasticity when price is $3 with the price elasticity when price is $8,we can conclude that
A) demand is more elastic when price is $8.
B) demand is more elastic when price is $3.
C) the price elasticity of demand is equal when price is $8 and when price is $3.
D) demand is elastic when price is $8 and unit elastic when price is $3.
E) demand is inelastic when price is $3 and unit elastic when price is $8.
Correct Answer:

Verified
Correct Answer:
Verified
Q153: Use the figure below to answer the
Q154: <img src="https://d2lvgg3v3hfg70.cloudfront.net/TB5272/.jpg" alt=" Figure 4.1.4 -Figure
Q155: When the price of gas is $1.00
Q156: When the price of a good increases
Q157: The elasticity of supply for airplane travel
Q159: The price of a plum falls by
Q160: Use the table below to answer the
Q161: If a 10 percent rise in price
Q162: If a 10 percent increase in income
Q163: If the quantity of carrots demanded increases