Multiple Choice
Use the figure below to answer the following questions. 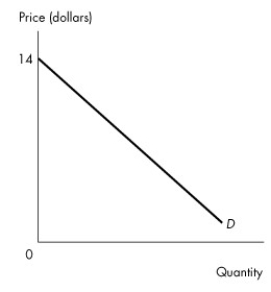 Figure 4.1.2
-Figure 4.1.2 illustrates a linear demand curve.If the price falls from $4 to $2,
A) total revenue increases.
B) total revenue decreases.
C) total revenue remains unchanged.
D) the quantity demanded increases by more than 10 percent.
E) the percentage change in quantity demanded is more than the percentage change in price.
Correct Answer:

Verified
Correct Answer:
Verified
Q31: <img src="https://d2lvgg3v3hfg70.cloudfront.net/TB5272/.jpg" alt=" Figure 4.1.4 -Figure
Q32: Demand for a good is unit elastic.When
Q33: In 2003,when music downloading first took off,Universal
Q34: With higher fuel costs,airlines raise their average
Q35: Sally's Ski Shoppe maximizes total revenue when
Q37: If the price elasticity of demand is
Q38: Which one of the following illustrates an
Q39: The price of an apple falls by
Q40: You are told that a 5 percent
Q41: Suppose the Lethbridge Computer Company decides to