Multiple Choice
Use the figure below to answer the following questions.
Table 3.5.2
Demand and Supply Schedules for Cups of Coffee each day at CoolU
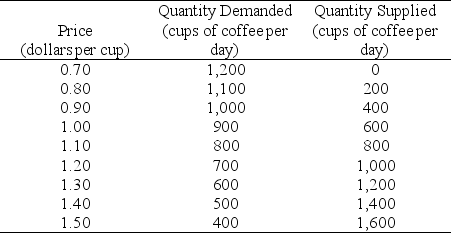
-Refer to Table 3.5.2.A premature frost destroys half the coffee trees.This change would be represented as a
A) leftward shift of the demand curve.
B) rightward shift of the demand curve.
C) leftward shift of the supply curve.
D) rightward shift of the supply curve.
E) movement down along the supply curve.
Correct Answer:

Verified
Correct Answer:
Verified
Q178: Suppose we observe a rise in the
Q179: Use the table below to answer the
Q180: Networks increase the price they charge cable
Q181: A turnip is an inferior good if<br>A)an
Q182: If A is an inferior good and
Q183: If we observe a rise in the
Q185: Use the figure below to answer the
Q186: The Genius Software Company has developed an
Q187: The demand curve slopes downward to the
Q188: Use the figure below to answer the