Multiple Choice
Use the figure below to answer the following questions. 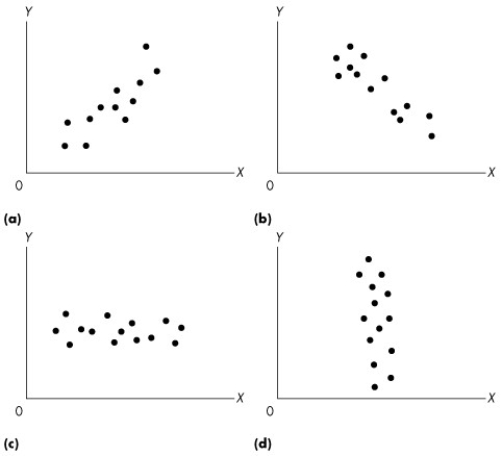 Figure 1A.1.1
-The graphs in Figure 1A.1.1 are examples of
A) dot graphs.
B) graphs that show no relationship between x and y.
C) dot diagrams.
D) scatter diagrams.
E) none of the above.
Correct Answer:

Verified
Correct Answer:
Verified
Q99: Choose the correct option regarding the earnings
Q100: The problem of scarcity exists<br>A)only in economies
Q101: Use the figure below to answer the
Q102: Use the information below to answer the
Q103: Use the information below to answer the
Q105: Choose the correct statement.<br>A)Canada produces more services
Q106: Use the figure below to answer the
Q107: If variables x and y move up
Q108: The inescapable economic fact is that<br>A)there are
Q109: Which of the following creates an incentive