Multiple Choice
Use the figure below to answer the following questions. 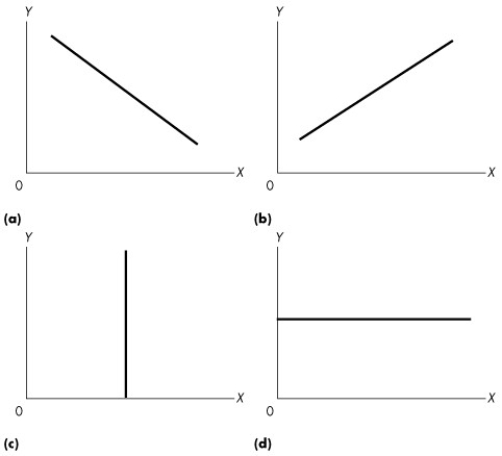 Figure 1A.2.4
-Refer to Figure 1A.2.4.If theory predicts that a rise in the wage rate (x) leads to a rise in the amount of labour supplied in the economy (y) ,which graph represents this relationship?
A) (a)
B) (b)
C) (c)
D) (d)
E) (a) or (c)
Correct Answer:

Verified
Correct Answer:
Verified
Q93: Use the table below to answer the
Q94: Use the figure below to answer the
Q95: The creation of a successful movie can
Q96: Consider graph (b)of Figure 1A.2.1.Which one of
Q97: "The rich face higher income tax rates
Q99: Choose the correct option regarding the earnings
Q100: The problem of scarcity exists<br>A)only in economies
Q101: Use the figure below to answer the
Q102: Use the information below to answer the
Q103: Use the information below to answer the