Multiple Choice
Use the figure below to answer the following questions. 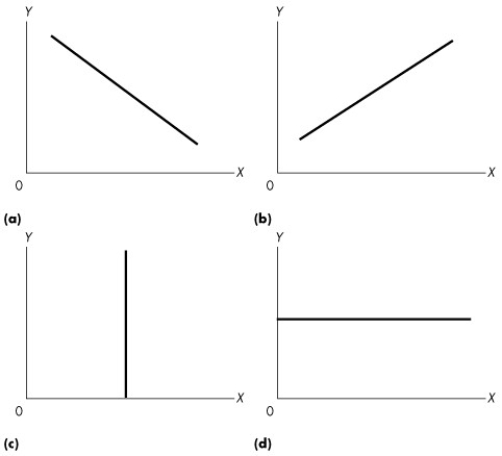 Figure 1A.2.4
-Refer to Figure 1A.2.4.Suppose theory predicted that for low levels of quantity produced (x) a firm's profits (y) were low,for medium levels of output their profits were high,and for high levels of output their profits were low again.Which one of the graphs would represent this relationship?
A) (a)
B) (b)
C) (c)
D) (d)
E) none of the graphs
Correct Answer:

Verified
Correct Answer:
Verified
Q153: What is the slope across the arc
Q154: Use the table below to answer the
Q155: Which one of the following is an
Q156: Use the figure below to answer the
Q157: Use the table below to answer the
Q159: Marginal benefit is the<br>A)total benefit from an
Q160: If the equation of a straight line
Q161: The equation of a line is y
Q162: Use the figure below to answer the
Q163: Two variables are negatively related if<br>A)increases in