Multiple Choice
Use the figure below to answer the following question. 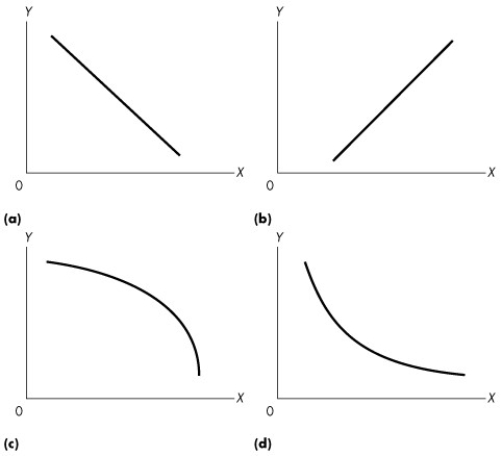 Figure 1A.2.7
-Refer to Figure 1A.2.7.Consider the values for x and y given in the following table: 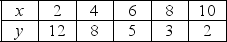 Which one of the graphs in Figure 1A.2.7 represents the relationship between x and y?
A) (a)
B) (b)
C) (c)
D) (d)
E) (a) and (b)
Correct Answer:

Verified
Correct Answer:
Verified
Q120: Given the data in Table 1A.4.2,holding price
Q121: In a world characterized by scarcity<br>A)all goods
Q122: In Canada _ percent of the adult
Q123: What choices are best for the entire
Q124: Use the figure below to answer the
Q126: An art museum decides to offer audio
Q127: Use the table below to answer the
Q128: Use the figure below to answer the
Q129: Complete the following sentence.Marginal cost is<br>A)the total
Q130: Chanel has the option of purchasing one