Multiple Choice
Use the figure below to answer the following question. 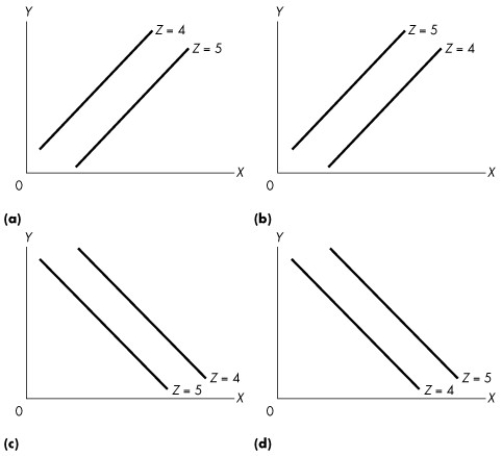 Figure 1A.4.1
-Given the data in the following table,which one of the graphs in Figure 1A.4.1 correctly represents the relationship among x,y,and z? 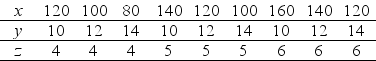
A) (a)
B) (b)
C) (c)
D) (d)
E) (b) and (c)
Correct Answer:

Verified
Correct Answer:
Verified
Related Questions
Q175: Which of the following is a microeconomic
Q176: A tractor is an example of which
Q177: To graph a relationship among three variables
Q178: During the next hour John can choose
Q179: Self-interest choices are<br>A)those choices which are best
Q181: The expansion of international trade,borrowing and lending,and
Q182: Which of the following is not a
Q183: Use the figure below to answer the
Q184: If you take an additional class this
Q185: Use the figure below to answer the