Multiple Choice
Use the figure below to answer the following question. 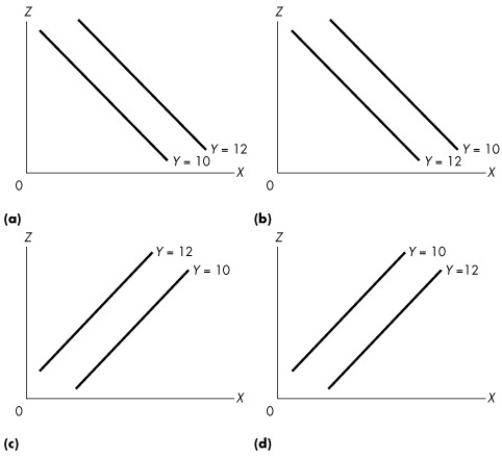 Figure 1A.4.2
-Given the data in the following table,which one of the graphs in Figure 1A.4.2 correctly represents the relationship among x,y,and z? 
A) (a)
B) (b)
C) (c)
D) (d)
E) (a) and (d)
Correct Answer:

Verified
Correct Answer:
Verified
Q74: When a farmer decides to harvest tomatoes
Q75: Which of the following statements is correct?<br>A)Canada
Q76: Which of the following equations describes a
Q77: Use the figure below to answer the
Q78: To meet increased demand for its good,a
Q80: Complete the following sentence.Financial capital is<br>A)one of
Q81: Use the figure below to answer the
Q82: Complete the following sentence.Macroeconomics<br>A)is primarily concerned with
Q83: The branch of economics that studies the
Q84: When a firm decides to produce more