Multiple Choice
Use the table below to answer the following question.
Table 1A.4.3
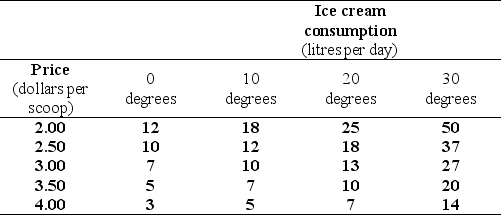
-Refer to Table 1A.4.3.The table shows some data on the quantity of ice cream consumed at different prices and in different weather conditions.To draw a graph of the relationship between the quantity of the ice cream consumed and the price of ice cream,we must
A) decrease the temperature as the price rises.
B) pick the temperature that prevailed when the price was $2.00.
C) increase the temperature as the price rises.
D) hold the temperature constant at any of the four levels shown.
E) hold the price constant at any of the five levels shown.
Correct Answer:

Verified
Correct Answer:
Verified
Q140: A normative statement is<br>A)about what ought to
Q141: Of the tasks listed below,an economics major
Q142: Consider graph (d)of Figure 1A.2.1.Which one of
Q143: Use the figure below to answer the
Q144: Which of the following newspaper headlines concerns
Q146: Use the figure below to answer the
Q147: Which one of the following would economists
Q148: Use the figure below to answer the
Q149: Select the best statement about economic models.<br>A)An
Q150: The most important skills needed for an