Multiple Choice
Use the figure below to answer the following question. 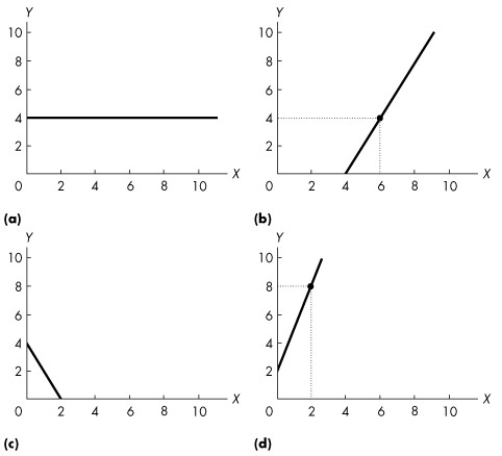 Figure 1A.5.3
-The equation of a line is y = 4 + 2x.Which one of the graphs in Figure 1A.5.3 represents this line?
A) (a)
B) (b)
C) (c)
D) (d)
E) none of the graphs
Correct Answer:

Verified
Correct Answer:
Verified
Q128: Use the figure below to answer the
Q129: Complete the following sentence.Marginal cost is<br>A)the total
Q130: Chanel has the option of purchasing one
Q131: Which of the following sayings best describes
Q132: Complete the following sentence.Microeconomics is<br>A)not concerned with
Q134: Use the figure below to answer the
Q135: Which factor of production includes the "gifts
Q136: Use the table below to answer the
Q137: A positive statement is<br>A)always true.<br>B)always false.<br>C)about what
Q138: Which factor of production earns the most