Multiple Choice
Use the figure below to answer the following question. 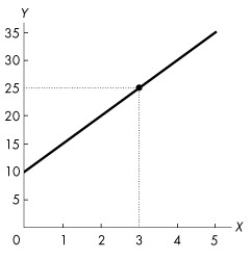 Figure 1A.5.4
-Refer to Figure 1A.5.4.The graph shows the relationship between two variables,x and y.This relationship is described by the equation
A) y = 5x2 + 10.
B) y = 10x + 5.
C) y = -5x + 10.
D) y = 5x + 10.
E) x = 10 + 5y.
Correct Answer:

Verified
Correct Answer:
Verified
Related Questions
Q23: Given the data in Table 1A.4.2,suppose family
Q24: Use the figure below to answer the
Q25: Use the figure below to answer the
Q26: Sally has to decide whether to study
Q27: Use the figure below to answer the
Q29: Consider the data in Table 1A.4.1.Suppose z
Q30: The study of how wages are set
Q31: "There can be too much of a
Q32: Monika will choose to eat a seventh
Q33: The equation of a line is y