Multiple Choice
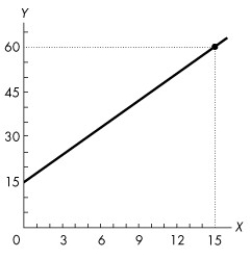
Use the figure below to answer the following question.  Figure 1A.5.5
-Refer to Figure 1A.5.5.The graph shows the relationship between two variables,x and y.Which of the following equations describes this relationship?
A) y = 3x + 15
B) y = -3x + 15
C) y = -3x2 + 15
D) y = 15x + 3
E) x = 15y + 3
Correct Answer:

Verified
Correct Answer:
Verified
Q194: Complete the following sentence.Economic models<br>A)do not answer
Q195: Which of the following is not a
Q196: Use the figure below to answer the
Q197: Operators of private dog parks in your
Q198: Which of the following is the best
Q200: Use the figure below to answer the
Q201: You have the choice to go skiing
Q202: A normative statement is a statement regarding<br>A)what
Q203: The fact that some people can afford
Q204: Use the figure below to answer the