Multiple Choice
In the cardiac and vascular function curves shown below,the solid curves represent the control state: 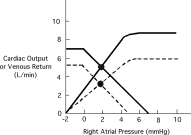 The shift in these curves,illustrated by the dashed lines,is best explained by:
A) Administration of positive inotropic agent.
B) Decrease in peripheral vascular resistance.
C) Infusion of isotonic saline.
D) Increase in peripheral vascular resistance.
E) Administration of a negative inotropic agent.
Correct Answer:

Verified
Correct Answer:
Verified
Related Questions