Short Answer
The graph in the figure shows the x component of the acceleration of a 2.4-kg object as a function of time (in ms). 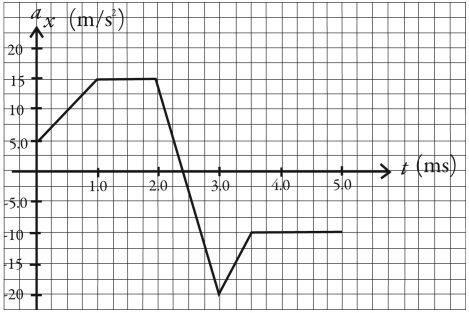
(a) At what time(s) does the x component of the net force on the object reach its maximum magnitude, and what is that maximum magnitude?
(b) What is the x component of the net force on the object at time t = 0.0 ms and at t = 4.0 ms?
Correct Answer:

Verified
(a) At 3.0...View Answer
Unlock this answer now
Get Access to more Verified Answers free of charge
Correct Answer:
Verified
View Answer
Unlock this answer now
Get Access to more Verified Answers free of charge
Q2: Which one of the following free-body diagrams
Q2: A car is being towed at constant
Q3: On its own,a certain tow-truck has a
Q17: An object is moving to the right,and
Q25: A ball is tossed vertically upward.When it
Q28: An 1100-kg car traveling at 27.0 m/s
Q42: A dog is standing in the bed
Q54: A 615 N student standing on a
Q78: A crate is sliding down an inclined
Q94: A woman is straining to lift a