Multiple Choice
In the figure, which of the curves best represents the variation of wave speed as a function of tension for transverse waves on a stretched string? 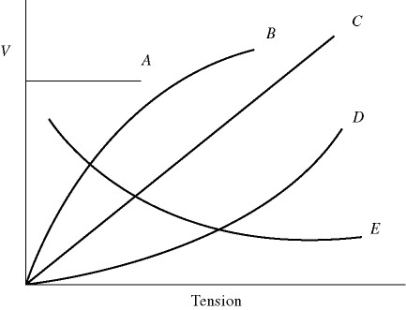
A) A
B) B
C) C
D) D
E) E
Correct Answer:

Verified
Correct Answer:
Verified
Related Questions
Q13: If the intensity level at distance d
Q14: For the wave shown in the figure,
Q18: The figure shows the displacement y of
Q19: The figure shows the displacement y of
Q19: As you stand by the side of
Q20: A transverse wave traveling along a string
Q24: A factory siren indicating the end of
Q37: The vertical displacement y(x,t)of a string stretched
Q39: A 6.0-m wire with a mass of
Q50: At a distance of 2.00 m from