Multiple Choice
The figure shows the graph of the position x as a function of time for an object moving in the straight line (the x-axis) . Which of the following graphs best describes the velocity along the x-axis as a function of time for this object? 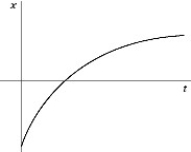
A) 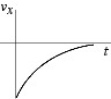
B) 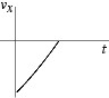
C) 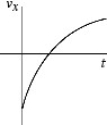
D) 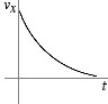
E) 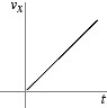
Correct Answer:

Verified
Correct Answer:
Verified
Related Questions
Q5: A package is dropped from a helicopter
Q12: A soccer ball is released from rest
Q24: To determine the height of a flagpole,Abby
Q30: On the earth, when an astronaut throws
Q31: The velocity of an object is given
Q33: The motion of a particle is described
Q37: A cat runs along a straight line
Q39: An object starts its motion with a
Q47: Suppose that a car traveling to the
Q52: A dragster starts from rest and travels