Multiple Choice
A graph of the force on an object as a function of its position is shown in the figure. Determine the amount of work done by this force on an object that moves from x = 1.0 m to x = 6.0 m. (Assume an accuracy of 2 significant figures for the numbers on the graph.) 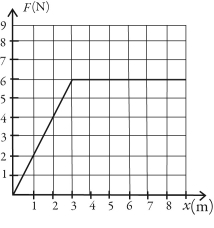
A) 26 J
B) 29 J
C) 22 J
D) 35 J
E) 27 J
Correct Answer:

Verified
Correct Answer:
Verified
Q5: A student slides her 80.0-kg desk across
Q20: A potential energy function for system 1
Q22: The potential energy for a certain mass
Q32: Two identical balls are thrown directly upward,ball
Q43: A child pulls on a wagon with
Q54: You carry a 7.0 kg bag of
Q90: A 2.0 kg mass is moving along
Q91: The angle between vector <img src="https://d2lvgg3v3hfg70.cloudfront.net/TB4469/.jpg" alt="The
Q96: A mass is pressed against (but is
Q97: A box of mass m is pressed