Multiple Choice
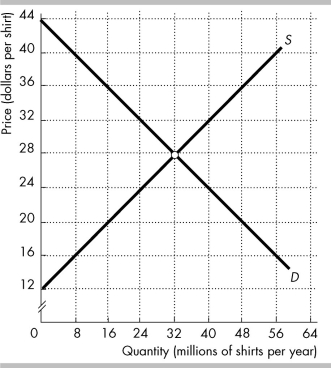 The figure shows the market for shirts in the United States, where D is the domestic demand curve and S is the domestic supply curve. The world price is $20 per shirt. The United States imposes a tariff on imported shirts of $4 per shirt.
-In the figure above, the tariff ________ the domestic production of shirts in the United States by ________ per year.
A) increases; 8 million
B) decreases; 16 million
C) increases; 4 million
D) decreases; 8 million
Correct Answer:

Verified
Correct Answer:
Verified
Q15: Suppose the country of Atlantica imposes a
Q16: <img src="https://d2lvgg3v3hfg70.cloudfront.net/TB8586/.jpg" alt=" The figure shows
Q17: In 2006, the European Union (EU) threatened
Q18: Export subsidies are<br>A) payments by the government
Q19: Which of the following best describes the
Q21: If the United States imposes a tariff
Q22: Compared to the situation before international trade,
Q23: Some people assert that protection from foreign
Q24: In 2006, European Union tariff on imported
Q25: Define comparative advantage and discuss its role