Multiple Choice
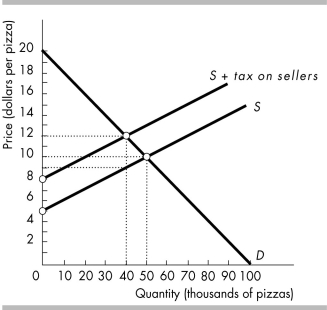
-Which of the following is NOT true about the $3 per pizza tax illustrated in the above figure?
A) It decreases consumer surplus by $90 thousand.
B) It decreases producer surplus by $45 thousand.
C) It creates a deadweight loss of $135 thousand.
D) None of the above because they are all true.
Correct Answer:

Verified
Correct Answer:
Verified
Q306: <img src="https://d2lvgg3v3hfg70.cloudfront.net/TB8586/.jpg" alt=" -You are in
Q307: <img src="https://d2lvgg3v3hfg70.cloudfront.net/TB8586/.jpg" alt=" -The table gives
Q308: <img src="https://d2lvgg3v3hfg70.cloudfront.net/TB8586/.jpg" alt=" -The figure above
Q309: Which of the following is NOT a
Q310: How does a production quota influence farm
Q312: <img src="https://d2lvgg3v3hfg70.cloudfront.net/TB8586/.jpg" alt=" -The figure above
Q313: <img src="https://d2lvgg3v3hfg70.cloudfront.net/TB8586/.jpg" alt=" -Suppose the government
Q314: What is a minimum wage? What are
Q315: <img src="https://d2lvgg3v3hfg70.cloudfront.net/TB8586/.jpg" alt=" -The above figure
Q316: A rent ceiling results in a shortage