Multiple Choice
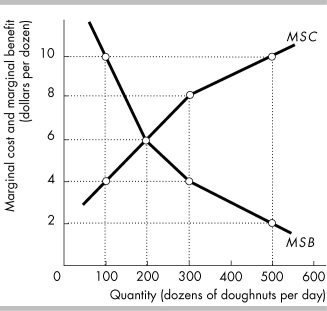
-The above figure shows the marginal social benefit and marginal social cost curves of doughnuts in the nation of Kaffenia. Which of the following would lead the quantity of doughnuts in Kaffenia to differ from the efficient quantity?
A) The existence of many producers and sellers of doughnuts.
B) The existence of just one producer and seller of doughnuts.
C) Damage to the environment from the disposal of oil used to cook the doughnuts.
D) Both answers B and C are correct.
Correct Answer:

Verified
Correct Answer:
Verified
Q122: At the current level of output, the
Q123: Suppose there are four firms that are
Q124: The market supply curve is also the<br>A)
Q125: <img src="https://d2lvgg3v3hfg70.cloudfront.net/TB8586/.jpg" alt=" -What is the
Q126: "If the marginal social benefit of a
Q128: <img src="https://d2lvgg3v3hfg70.cloudfront.net/TB8586/.jpg" alt=" -In the above
Q129: <img src="https://d2lvgg3v3hfg70.cloudfront.net/TB8586/.jpg" alt=" -The above figure
Q130: <img src="https://d2lvgg3v3hfg70.cloudfront.net/TB8586/.jpg" alt=" -The figure above
Q131: <img src="https://d2lvgg3v3hfg70.cloudfront.net/TB8586/.jpg" alt=" -In the above
Q132: If the marginal cost of producing hair